
Figure 6.
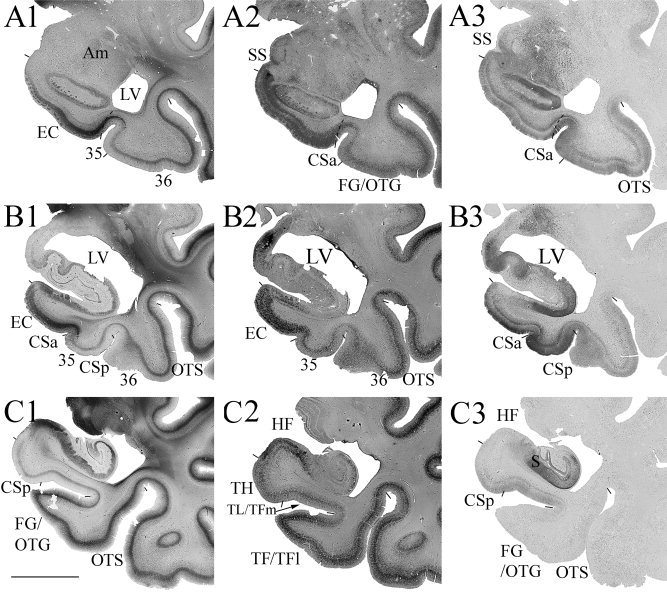
Photomicrographs of representative coronal sections through three different AP levels (A–C) of the MTL from a normal aging case with a Type II CS (shallow) and no RS show the main features of areas 35 and 36 in comparison with adjoining EC and areas TEv, TH, TL/TFm, and TF/TFl. At each AP level, three adjacent sections were shown and they were stained for PV (A1–C1), WFA (A2–C2), and AT8 (A3–C3), respectively. Borders of areas 35 and 36 and adjoining areas were defined by a combined analysis of different markers. Clear differences between the anterior FG/OTG (area 36 in A1–A3, B1–B3) and posterior FG/OTG (area TF/TFl in C1–C3) is appreciated in PV (B1, C1), WFA (B2, C2) and AT8 (B3, C3) stained sections. Note the distinct staining intensity in areas 35, 36 and TEv in AT8‐stained sections (A3–C3). Difference in staining intensity of areas 36 and TL/TFm is also seen in PV (B1, C1) and WFA (B2, C2) stained sections. For abbreviations, see list. Scale bar: 1 cm.