
Figure 1.
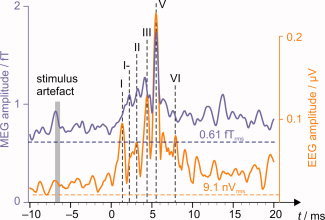
Grand average across all subjects and all 102 magnetometer channels. Filtered (180–1,000 Hz) MEG and EEG signals were latency‐normalized with respect to the individually‐determined Wave V prior to computing the root‐mean‐squared average. The click was delivered to the ear canal at zero time. The magnetic artefact originated in the stimulator 2 m from the ear. Dashed horizontal lines indicate intrinsic MEG and EEG system noise levels.