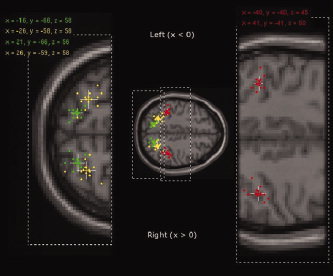
Figure 2.

Peak point activation loci for each individual's analysis in Experiments 1 and 2. The cross shows the mean position of each data set. The colored part of the cross indicates standard error of mean and the white continuation of the cross indicates one standard deviation from the mean. All data is provided in the tables given as supplementary data. Red: loci for individual's significant activations in AIP elicited by orientation discrimination vs. color discrimination (P < 0.05 small volume corrected (20‐mm radius sphere centered at left AIP, x = −40, y = −40, z = 40; and right AIP, x = 40, y = −40, z = 44; (Binkofski et al., 1999)). Green: loci for individual's significant activations in CIP elicited by orientation discrimination vs. color discrimination (P < 0.05 small volume corrected (20 mm radius sphere centered at left CIP, x = −16, y = −68, z = 57; and right CIP, x = 20, y = −67, z = 58; (Shikata et al., 2001)). Yellow: loci for individual's significant activations in the middle part of IPS elicited by saccadic eye movements vs. fixation (P < 0.05 FDR small volume corrected using the functionally derived region of interest, (see Methods: Definition of Regions of Interest section)). Enlarged images are taken from MNI brain z = 58 (left) and z = 45 (right).
