
Figure 1.
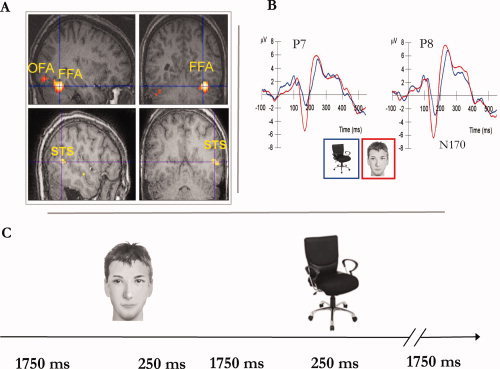
Functional MRI and event‐related potential (ERP) face‐selective responses. A. Regions that show a face‐selective response in one representative subject (face > chairs, P < 0.001). These regions were individually identified in each subject. Face‐selective voxels in the mid fusiform gyrus were defined as the fusiform face area (FFA), in the posterior part of the superior temporal sulcus as the fSTS and in the lateral occipital cortex as the occipital face area (OFA). B. ERP responses to faces and chairs averaged across all subjects in channels P7 and P8. A larger negative potential is revealed in response to faces than chairs at 170 ms after stimulus onset (N170). C. Subjects were presented with grayscale images of faces and chairs in a pseudo‐randomized order. A stimulus was presented for 250 ms. Each trial lasted 2 s. [Color figure can be viewed in the online issue, which is available at wileyonlinelibrary.com.]