
Figure 2.
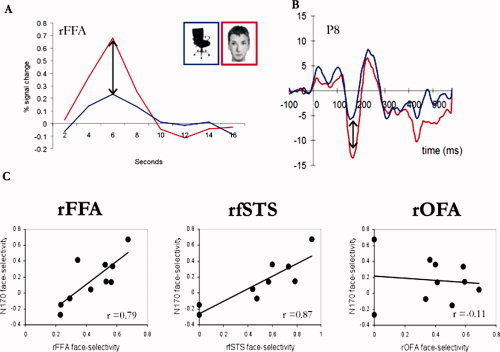
The face‐selective N170 is strongly correlated with face‐selective brain areas in the temporal cortex but not in the occipital cortex. A. Percent signal change to faces and chairs in the FFA of a single representative subject. An fMRI face‐selective index (see methods) was computed for each subject based on the amplitude of the hemodynamic response to faces and chairs in the OFA, FFA and fSTS. B. An ERP to faces and chairs of a single representative subject. An ERP face‐selective index was computed for each individual based on the peak amplitude of the N170 to faces and chairs. C. Scatter plots display the correlations between fMRI and ERP face‐selective indices across subjects. Each dot represents one individual. Strong correlations were found between the N170 face‐selectivity and the face‐selectivity of the FFA and fSTS but not with the face‐selectivity of the OFA over the right hemisphere. [Color figure can be viewed in the online issue, which is available at wileyonlinelibrary.com.]