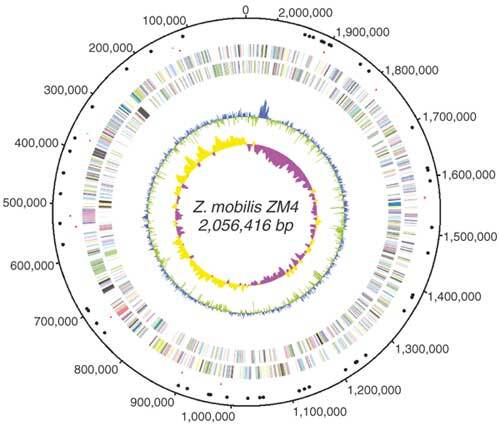
Figure 1. Overall features of the Z. mobilis ZM4 genome.

The putative origin of replication is around 0 kb. The outer scale indicates the coordinates in base pairs. The distribution of genes is shown on the first two rings within the scale according to the direction of the reading frame. The locations of rRNA and tRNA genes are shown by green dots and black dots, respectively. Putative transposases are shown by red dots. The next circle shows GC content values. Cyan and green colors indicate positive and negative signs, respectively. The central circle shows GC-skew values (G−C/G+C) of the third bases of codons measured over the genome. Yellow and purple colors denote positive and negative signs, respectively. The window size was 10,000 nucleotides and the step size was 1,000 nucleotides.
