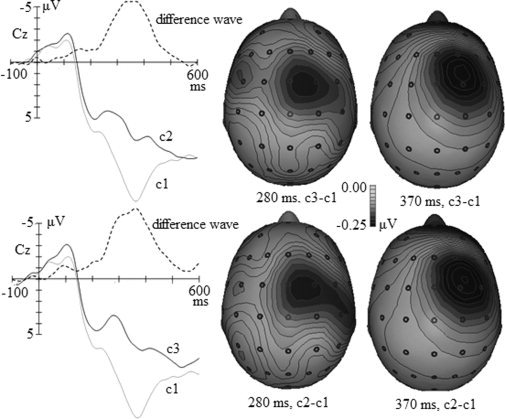
Figure 6.

Grand average of ERPs in response to c1, c2, c3, and the difference waves (c2−c1 and c3−c1) at Cz and topographic maps of the difference waves at 280 ms and 370 ms. The two grand averages and c2−c1 difference waves are presented in the upper left panel, and the two grand averages and c3−c1 difference waves are in the lower left panel. The topographic maps of the c2−c1 difference wave at 280 ms and 370 ms are presented in the upper right panel, and those of the c3−c1 difference wave at 280 and 370 ms are presented in the lower right panel.
