
Figure 5.
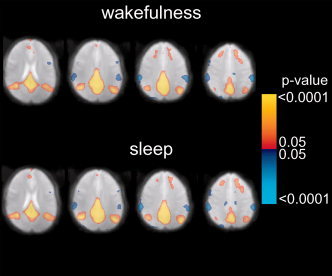
Statistical composite maps (n = 6) showing the temporal correlation of the percentage BOLD signal change with the seed in the posterior cingulate ROI during wakefulness (top) and sleep (bottom). Four representative axial slices show similar default‐mode network correlations during wakefulness and light sleep. Color scale represents p‐values, thresholded at P = ±0.05 (corrected). Positive (red‐yellow) and negative (blue) correlations are shown.