
Figure 5.
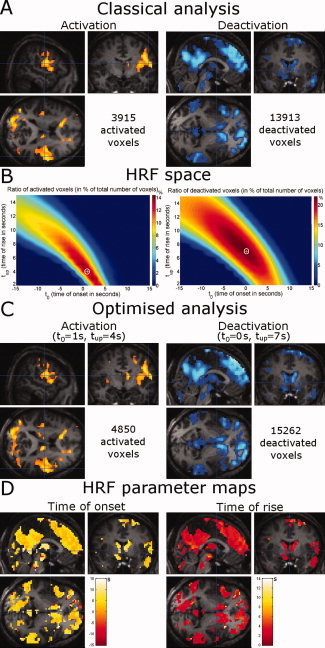
Patient 1: frontal lobe epilepsy. (A) Activation and deactivation patterns using classical HRF (P < 0.005, FDR‐corrected, extent threshold = 50 voxels). (B) Ratio of activated and deactivated voxels in the HRF space. (C) Activation and deactivation patterns using optimal HRF (P < 0.005, FDR‐corrected, extent threshold = 50 voxels). (D) HRF parameter maps (left: time of onset t 0; right: time of rise t up). [Color figure can be viewed in the online issue, which is available at www.interscience.wiley.com.]