
Figure 3.
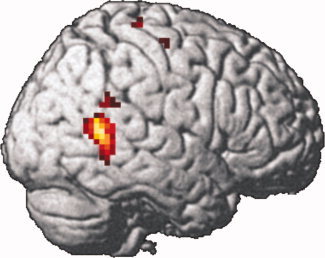
Additional voxelwise analysis: Positive correlation between the individual audiovisual integration effect [AV − max(A, V)] and trait EI (SREIT scores). Height threshold at P < 0.005, uncorrected, cluster size k > 30, voxel size: 27 mm3. The cluster within the right pSTS is significant at P ≤ 0.05, two‐tailed, corrected for multiple comparisons across the anatomical ROI and Bonferroni‐corrected for the number of anatomical ROIs. [Color figure can be viewed in the online issue, which is available at www.interscience.wiley.com.]