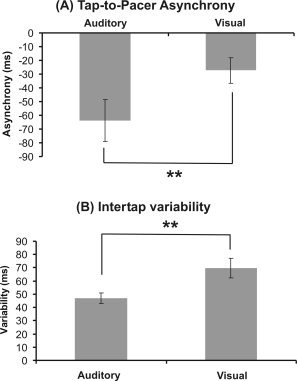
Figure 1.

Behavioural data. (A) Tap‐to‐pacer asynchrony during auditory and visual synchronization. (B) Intertap variability depending on the modality of the pacing signal. Error bars indicate standard error of mean (s.e.m.). Asterisks indicate significant differences (**P = 0.01).
