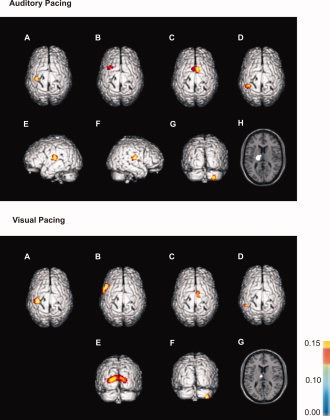
Figure 2.

Mean source localizations identified during auditory and visual synchronization as determined by SPM99. Upper panel: (A) primary sensorimotor cortex (S1/M1), (B) dorsal premotor cortex (PMd), (C) supplementary motor area (SMA), (D) posterior parietal cortex (PPC), (E/F) superior temporal gyrus, (G) ipsilateral cerebellum, (H) thalamus. Lower panel: (A) primary sensorimotor cortex (S1/M1), (B) ventral premotor cortex (PMv), (C) supplementary motor area (SMA), (D) posterior parietal cortex (PPC), (E) occipital cortex (OC), (F) ipsilateral cerebellum, (G) thalamus. Please note that the source within S1/M1 was localized with respect to EDC. Sources within superior temporal sulcus and occipital cortex were localized with respect to the respective pacing signal. All other sources were identified with S1/M1 as reference region. Coherence strength is color coded: yellow indicates stronger coherence, whereas blue indicates weaker coherence. Please note that SPM99 has been used for visualization of mean source localizations, only. Maps do not represent any statistical comparison between the two pacing conditions.
