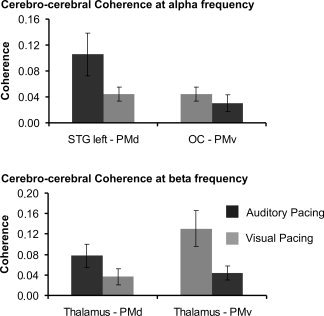
Figure 3.

Mean cerebrocerebral coherence associated with auditory and visual synchronization as a measure of functional interaction. Error bars indicate s.e.m. The figure indicates absolute coherence values for those connections showing significant differences between visual and auditory synchronization.
