
Figure 4.
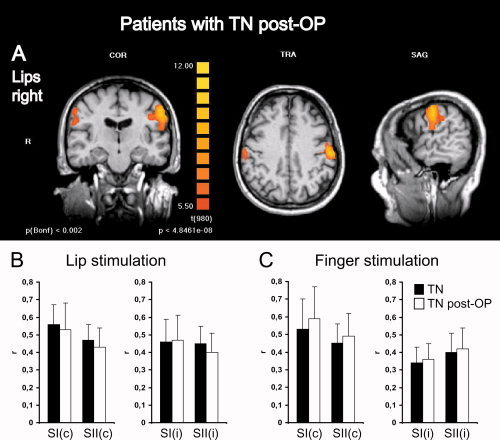
Somatosensory activations in patients with TN show no differences before and after neurosurgical treatment and prolonged pain relief. (A) Group level fMRI of bilateral somatosensory activations in the postcentral gyrus and parietal operculum in patients with TN on the right side after successful microvascular decompression by Jannetta technique are shown for stimulation of the right lips. To conserve anatomical details, group level BOLD‐activation maps (n = 10) were overlaid onto anatomical images of one individual subject. Left panels show a coronal view (COR) through the plane of the postcentral gyrus, middle panels a transversal view (TRA) through the plane of SI activations and left panels a sagittal view (SAG) through the plane of contralateral activations. R, right; L, left. Colors depict the t‐statistic with uncorrected and Bonferoni corrected P‐values. Statistical thresholds were chosen as in Figure 3 to allow comparison of activation maps. Histograms depict quantitative analyses of r‐values (mean ± SD) comparing SI and SII activations in patients with TN before (black bars) and after pain relief (white bars) for lip (B) and finger (C) stimulations. c, contralateral; i, ipsilateral; r, correlation of the measured BOLD‐signal to the applied hemodynamic reference function.