
Figure 5.
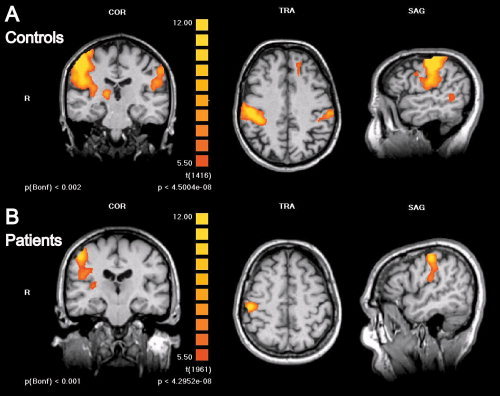
Somatosensory activations are significantly reduced in patients with TN as compared to healthy subjects. Group level fMRI of bilateral somatosensory activations in the postcentral gyrus and parietal operculum in control subjects (n = 13) (A) and patients with TN (n = 18) (B) are shown for stimulation of the right fingers. Activation maps are presented as in Figures 3 and 4 and statistical thresholds for image display were kept constant for easier comparison. BOLD‐activation is visibly reduced in patients versus controls; at the chosen threshold no ipsilateral SI/SII activation is displayed in the patients' fMRI. Note contralateral thalamic activation in (A) (left panel).