
Figure 6.
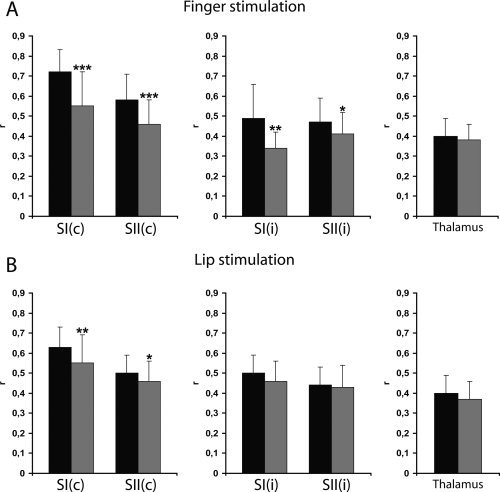
Quantitative assessment of somatosensory activations in patients with TN and healthy subjects. Correlations of BOLD‐signals to the applied hemodynamic reference function (r; mean ± SD) are plotted for contra‐ and ipsilateral SI and SII and contralateral thalamic activations for finger (A) and lip (B) stimulations in healthy controls (black bars) and patients with TN (gray bars). c, contralateral; i, ipsilateral. Levels of statistical significance: ***P < 0.0001, **P < 0.01, *P < 0.05.