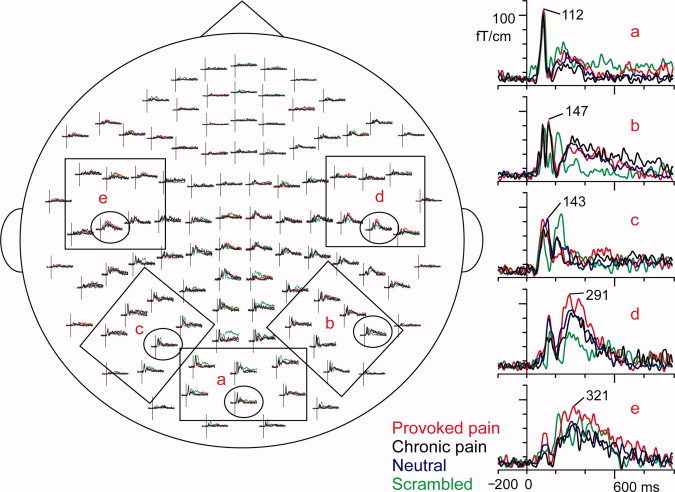
Figure 3.

Sample responses of a typical subject and the channel layout of the vector sums calculated from two orthogonal gradiometers, seen from above. On left, the selections show the six channels of each area, from which the areal averages were calculated on the basis of the maximum responses: (a) occipital cortex, (b) right temporo‐occipital cortex, (c) left temporo‐occipital cortex, (d) right temporal lobe, and (e) left temporal lobe. On right, the representative responses, encircled in the whole‐scalp view, have been magnified. The traces are from −200 ms to 1000 ms, and the amplitudes are given as fT/cm. The latencies of the peak amplitudes are marked on the single channel responses. Red, Provoked pain face; black, Chronic pain face; blue, Neutral face; green, Scrambled face.
