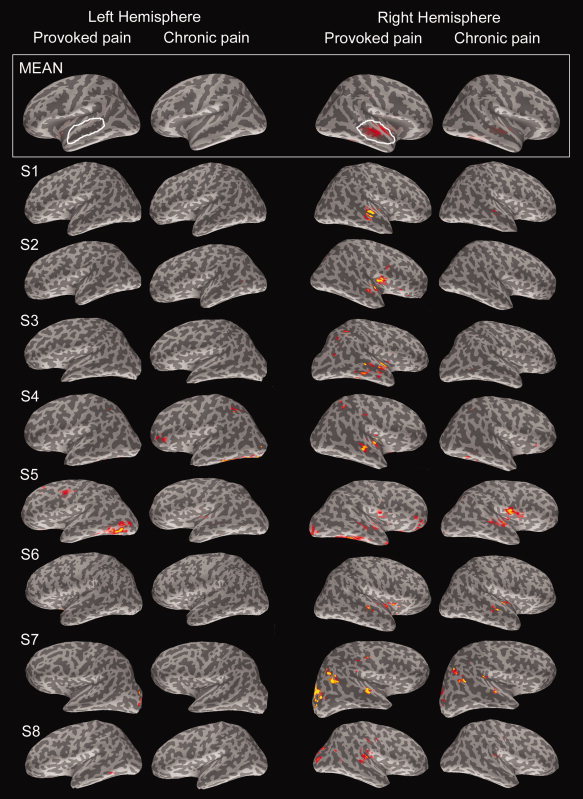
Figure 6.

Estimates of the sources of the 300–500‐ms activity in the whole cortex. The average (MEAN) across all subjects is overlaid on the atlas brain, and the current estimates of subjects S1–S8 are shown on their individual brain surface maps. Estimates for Provoked and Chronic pain faces of the first measurement session are shown separately in the left and right hemisphere. For visualization purposes, the color scales are individually normalized with respect to the individual signal‐to‐noise ratio. In the grand average current estimates (MEAN) in the topmost panel, white ovals represent the ROIs for numerical statistical comparisons of the z‐score amplitudes for Provoked and Chronic pain conditions.
