
Figure 4.
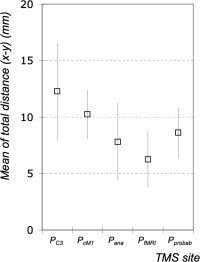
Total mean distances (x–y) and standard deviations (SD) in mm between the MEP‐CoG and the positions localized using the International 10–20 EEG system (P C3), a standardized function‐guided procedure (P cM1), structural (i.e., anatomical) MR image (P ana), functional MRI data (single subject) (P fMRI), and functional MRI data (group data/“prohabilistic approach”) (P Probab). Data were averaged from all subjects.