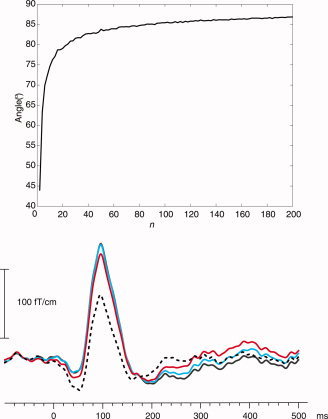
Figure 4.

Top: The mean angle between two randomly chosen vectors as a function of their dimension, n. The vectors were composed as linear combinations of orthonormal sine and cosine components, with uniformly distributed random amplitudes ranging from −1 to 1. Bottom: The effect of window length T on the tSSS‐reconstructed auditory response. The values of T were 1 s (black dashed), 2 s (red), 4 s (blue), and 8 s (black solid; under the blue curve during the peak). The data were low‐pass filtered at 70 Hz.
