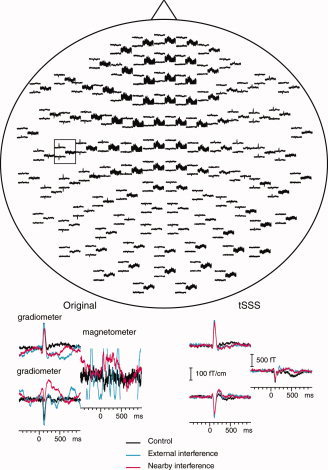
Figure 5.

Top: Averaged auditory responses from the 306 channels during the Control condition. The display shows all channels as viewed from above the head, with the subject's nose pointing up in the plane of the paper. The sensor array contains sensor triplets, with two orthogonal planar gradiometers and one magnetometer in each triplet. Bottom: Original (left) and tSSS‐processed (right) averaged signals from a subset of two gradiometers and one magnetometer indicated by the rectangle in the upper figure.
