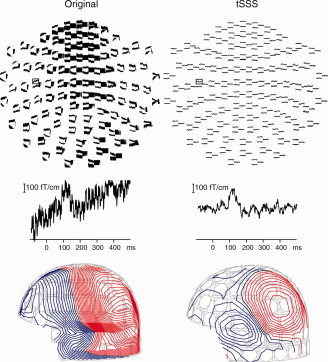
Figure 7.

Spatial distribution of a single auditory response before (top left) and after (top right) tSSS processing. No further temporal filtering was applied. The channel of the close‐up is indicated by a rectangle. Bottom: The corresponding field distribution of a single auditory response before (left) and after (right) tSSS processing. The contour step is 100 fT.
