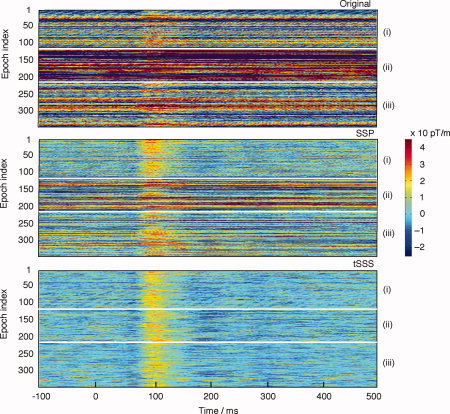
Figure 8.

Single‐trial plot of 340 consecutive individual auditory responses (108, 102, and 130, respectively, for the three different conditions) after three different processing procedures: Original (top panels), data processed by the standard SSP operator corresponding to usual environmental interference (middle panels), tSSS‐reconstructed data (bottom). In all boxes, the different conditions are displayed in the order Control (i), External interference (ii), and Nearby interference (iii); these conditions are separated in each panel by thin white horizontal lines.
