
Figure 9.
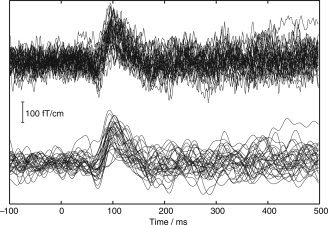
Thirty consecutive tSSS‐reconstructed auditory responses from the Control condition. The upper curves contain the whole frequency band 0.1–200 Hz, whereas the lower signals have been low‐pass filtered at 40 Hz.
Official websites use .gov
A
.gov website belongs to an official
government organization in the United States.
Secure .gov websites use HTTPS
A lock (
) or https:// means you've safely
connected to the .gov website. Share sensitive
information only on official, secure websites.
Thirty consecutive tSSS‐reconstructed auditory responses from the Control condition. The upper curves contain the whole frequency band 0.1–200 Hz, whereas the lower signals have been low‐pass filtered at 40 Hz.