
Figure 1.
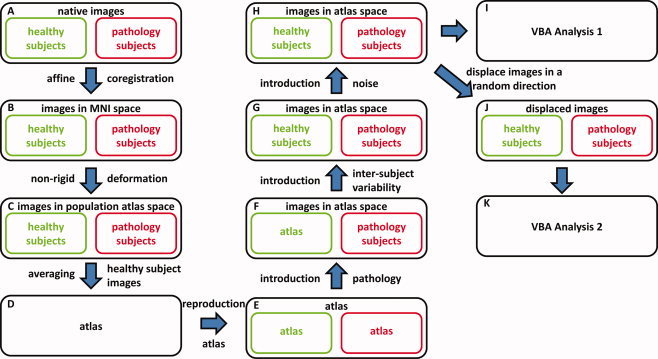
In the construction framework of the simulated data sets, native images of healthy and pathology subjects (A) are transformed to the MNI template using an affine transformation (B). Thereafter, a DTI atlas is constructed from these images (C, D). This atlas is reproduced N times (E) and a simulated pathology is added in half of these atlas data sets (F). Subsequently, intersubject variability (G) and noise (H) are added to all images. The resulting data sets are used in the VBA Analysis 1 (I). In VBA Analysis 2, these data sets are first displaced in a random direction by different distances (J, K). [Color figure can be viewed in the online issue, which is available at www.interscience.wiley.com.]