
Figure 4.
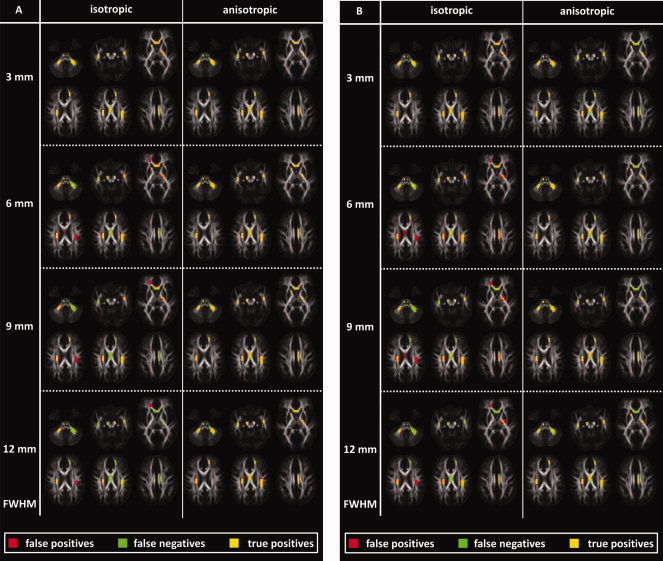
VBA results are visualized using both smoothing methods and various smoothing kernel widths. The voxels that contain a ground‐truth pathology and a significant VBA result are displayed in green and red, respectively. When both overlap, a yellow color is assigned to that voxel. False‐positive, false‐negative, and true‐positive results are therefore colored in red, green, and yellow, respectively. The voxels in which the background FA map is shown can be regarded as containing true‐negative results. A level of pathology corresponding with an FA decrease of 19 and 13% was used in the results of A and B, respectively. [Color figure can be viewed in the online issue, which is available at www.interscience.wiley.com.]