
Figure 1.
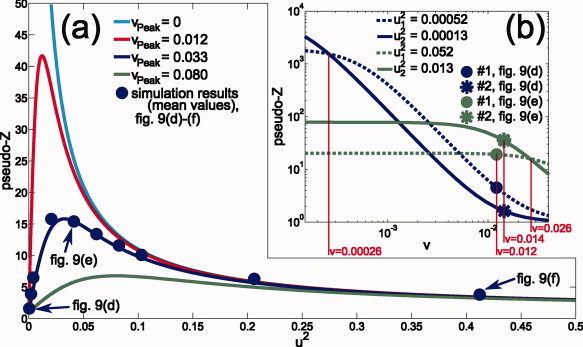
Theoretical pseudo‐Z curves: (a) u 2 ↦ Z 2 for local modeling errors v peak found for the simulations presented in Figures 9 and 10 [exact model (v peak = 0) and simplified model at minimum (0.012), mean (0.033), and maximum (0.080) of v peak]. The blue disks show simulation results (means across all sources, cf. Fig. 9) for different noise levels (including the noise levels presented in Fig. 9): σ2 = 2, 10, 20, 100, 200, 300, 400, 500, 1000, 2000 × 10−15 V2. (b) v ↦ Z 2 (logarithmic scales) for the sources #1 (disk) and #2 (asterisk) of the simulations highlighted in Figure 9d, blue curves, and Figure 9e, green curves. [Color figure can be viewed in the online issue, which is available at wileyonlinelibrary.com.]