
Figure 3.
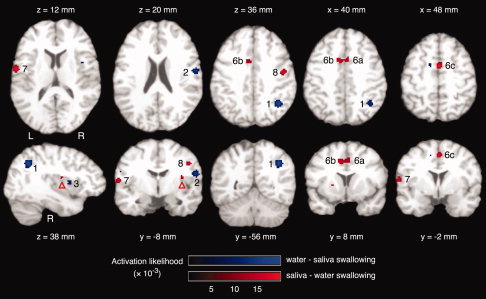
Comparison between the ALE maps for water swallowing versus rest (see Fig. 1) and saliva swallowing versus rest (see Fig. 2). Clusters with significantly higher activation likelihood for water swallowing versus rest are shown in blue, including the right inferior parietal lobule (1), right postcentral gyrus (2), and right insula (3). Clusters with significantly higher activation likelihood for saliva swallowing versus rest are shown in red, including the right (6a) cingulate gyrus, left cingulate gyrus (6b), right medial frontal gyrus (6c), left precentral gyrus (7), and right precentral gyrus (8). In the right insula, a small cluster is visible (red arrow head) that did not fulfill the minimum volume criterion. Axial and coronal images are oriented in neurological convention (the left hemisphere is shown on the left side of the figure). [Color figure can be viewed in the online issue, which is available at www.interscience.wiley.com.]