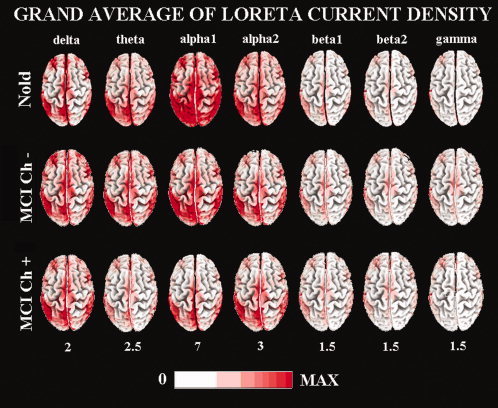
Figure 2.

Grand average of LORETA solutions (i.e. normalized relative current density at the cortical voxels) modeling the distributed EEG sources for delta, theta, alpha 1, alpha 2, beta 1, beta 2, and gamma bands in Nold, MCI C− (cholinergic lesion load <0.0065) and MCI Ch+ (cholinergic lesion load >0.0065). The left side of the maps (top view) corresponds to the left hemisphere. Legend: LORETA, low resolution brain electromagnetic tomography. Color scale: all power density estimates were scaled based on the averaged maximum value (i.e. alpha 1 power value of occipital region in Nold). The maximal value of power density is reported under each column. [Color figure can be viewed in the online issue, which is available at www.interscience.wiley.com.]
