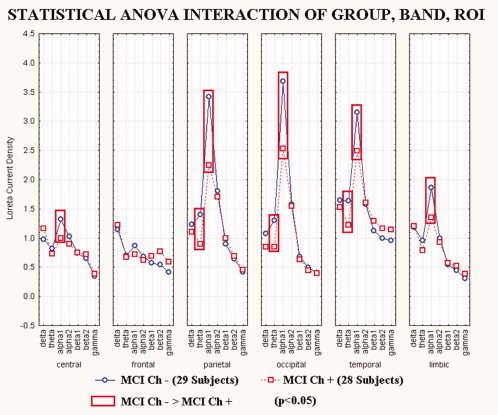
Figure 4.

Regional normalized LORETA solutions (mean across subjects) relative to a statistical ANOVA interaction (F(30,1650) = 1.60; MSe = 0.2; P < 0.0216) among the factors Group (MCI Ch, MCI Ch+), Band (delta, theta, alpha 1, alpha 2, beta 1, beta 2, gamma), and ROI (central, frontal, parietal, occipital, temporal, limbic). This ANOVA design used the regional normalized LORETA solutions as a dependent variable. Subjects' age, education, gender and individual alpha frequency peak (IAF) were used as covariates. Regional normalized LORETA solutions modeled the EEG relative power spectra as revealed by a sort of “virtual” intracranial macro‐electrodes located on the macrocortical regions of interest. Legend: the rectangles indicate the cortical regions and frequency bands in which LORETA solutions presented statistically significant LORETA patterns MCI Ch− > MCI Ch+ (P < 0.05). [Color figure can be viewed in the online issue, which is available at www.interscience.wiley.com.]
