
Figure 2.
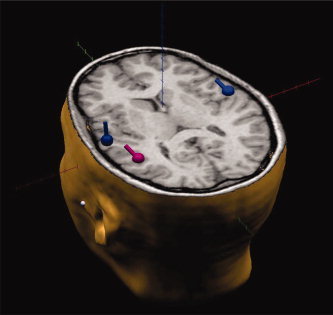
Three ECDs have been considered for the analysis of functional coupling. They are localized in the left PAC, right PAC, and Wernicke's area. [Color figure can be viewed in the online issue, which is available at www.interscience.wiley.com.]