
Figure 3.
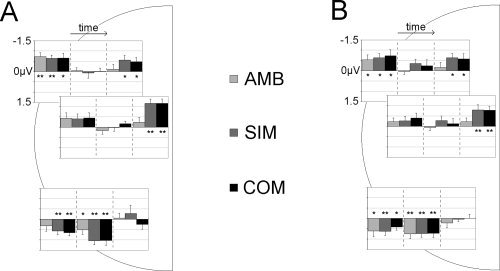
Mean ERL amplitudes per condition. Results are shown for (A) execution and (B) imagination sessions. Mean ERL amplitudes are depicted for the three electrode clusters used for statistical analysis, i.e., anterior (top inset), frontocentral (middle inset), and posterior (bottom inset) electrode sites. Insets read left to right from earliest to latest time window: 350–450 ms (ADAN, left), 500–600 ms (LDAP, middle), and 1200–1300 ms (LRP, right). Significant deviations from baseline amplitude are marked at the 0.05 (*) and 0.01 (**) level.