
Figure 4.
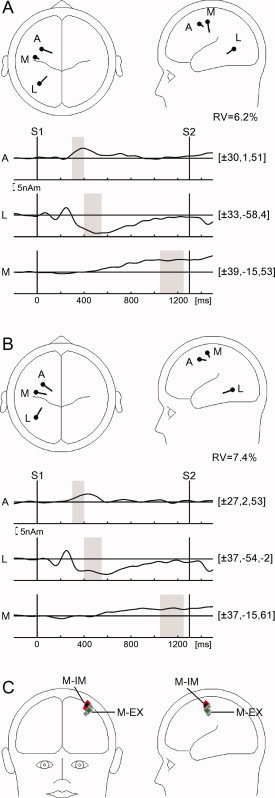
Results of dipole source analysis of foreperiod lateralized activity for (A) execution and (B) imagination sessions. Top insets in (A) and (B) show source locations in an average BESA head model for the ADAN (A), LDAP (L), and motor‐related (M) components. Sources in one hemisphere only are shown for ERL data. Bottom insets depict source waveforms for the ADAN (A), LDAP (L), and motor‐related (M) components. Source locations are shown as [x, y, z] in Talairach‐Tournoux coordinates. Source waveforms in the figure are low‐pass filtered at 6 Hz. Shaded bars indicate the time windows for which dipoles were fitted (for details see text). (C) Jacknife‐based motor‐related dipole sources for the imagination and execution sessions and grand‐mean based motor‐related dipole sources. Red diamonds indicate sources derived from jackknife subsamples (see text) for the imagination session, the black diamond represents the location of the grand mean motor‐related source for this session [(±37, −15, 61); cf. Fig. 4A]. Gray diamonds indicate sources derived from jackknife subsamples for the execution session, the green diamond represents the location of the grand‐mean motor‐related source for this session [(±39, −15, 53); cf. Fig. 4B]. Despite the tight clustering of jackknife sources around the respective grand‐mean source were the location difference between execution and imagination sources not statistically significant (see text). For the purpose of clarity of the figure all sources are shown without orientation information. [Color figure can be viewed in the online issue, which is available at www.interscience.wiley.com.]