
Figure 1.
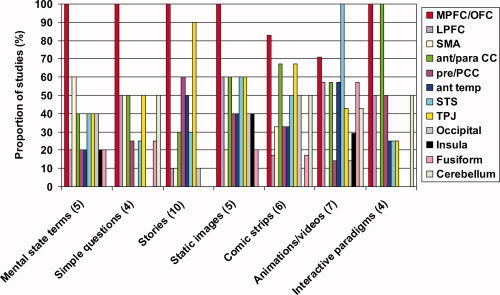
A comparison of the pattern of brain activity evoked by different ToM tasks. The number of studies implicating each brain region is displayed as a proportion of the number of studies employing each of the following experimental paradigms: mental state terms or word‐pairings [Baron‐Cohen et al.,1994,1999; Mason et al.,2004; Mitchell et al.,2005a], simple questions [Ganis et al.,2003; Kozel et al.,2004; Lee et al.,2002; Spence et al.,2001, stories [Fletcher et al.,1995; Gallagher et al.,2000; Gobbini et al.,2007; Kobayashi et al.,2007; Mitchell,2008; Sabbagh and Taylor,2000; Saxe and Kanwisher,2003; Saxe and Powell,2005; et al., 2001; Young and Saxe,2008], cartoons and other static images [Gallagher et al.,2000; Goel et al.,1995; Lissek et al.,2008; Mitchell et al.,2005b,2006], comic strips, including multi‐frame cartoons involving a choice phase [Brunet et al.,2000; Ciaramidaro et al.,2007; Kobayashi et al.,2007; Sommer et al.,2007; Vollm et al.,2006; Walter et al.,2004], animations and videos [Castelli et al.,2000; German et al.,2004; Gobbini et al.,2007; Grezes et al.,2004a,b; Iacoboni et al.,2005; Mosconi et al.,2005], and interactive paradigms [Calarge et al.,2003; Gallagher et al.,2002; McCabe et al.,2001; Rilling et al.,2004]. The numbers in parentheses refer to the number of studies in that category.