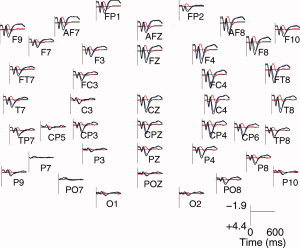
Figure 2.

ERP analysis. Grand average of the ERPs obtained for the following: processing of regular chords (represented by black lines), processing of irregular chords (blue), and the difference profiles (blue‐black, red). The response to the irregular chords is less positive than the response to the regular chords, leading to a negative component known as the ERAN.
