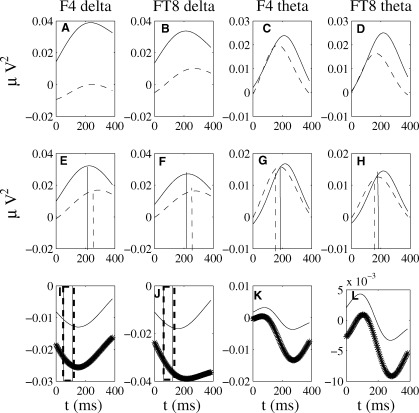
Figure 4.

Time course of the spectral power distribution of total and evoked delta and theta oscillatory activity (non‐normalized expression, Eq. (4) at the right‐hemisphere electrodes F4 and FT8 with average reference scheme. (A–D) Total oscillatory activity in the delta band (A,B) and theta band (C,D) for the irregular (dashed lines) and regular (solid lines) conditions showing clear larger values for the regular condition. (E–H) Same for the evoked oscillatory activity. Significant differences (P < 0.01) between the maximum poststimulus peak and mean baseline level are indicated at the average latency for regular chords (vertical solid lines) and irregular chords (vertical dashed lines). (I–L) Difference (irregular minus regular) total (dotted lines) and evoked (solid lines) oscillatory activity indicated in standard deviations from the 100–300 prestimulus baseline Eq. (5). Irregular chords exhibit less spectral power as compared with regular chords, both in the phase‐locked and in the total oscillations. The vertical lines represent regions of significance (P < 0.05) for the comparison conditions in the delta band phase‐locked and total spectral power.
