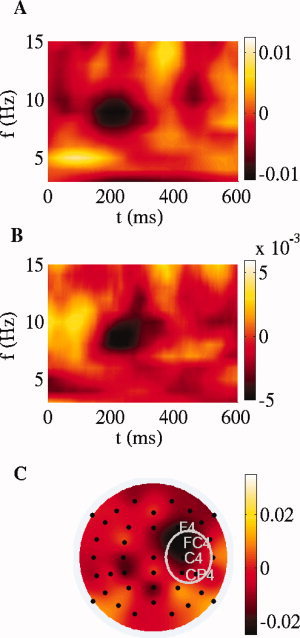
Figure 7.

SCA. Time‐frequency plot of the difference between supertonic condition and regular condition for the cluster strength, in the frequency range <15 Hz, (A) using the mean of the mastoids behind the ears as reference and (B) after spherical spline Laplacian. (C) Topographical distribution of the difference between conditions of the synchronization strength between each electrode and cluster, obtained for 8 ROIs by averaging the 8–9 Hz index between 185 and 210 ms. A ROI‐wise paired permutation test over subjects in each ROI was computed to detect the statistical differences between supertonic and tonic condition. The permutation test yielded significant differences (P < 0.01) at right central electrodes, the ROI which is indicated by the white ellipse.
