
Figure 1.
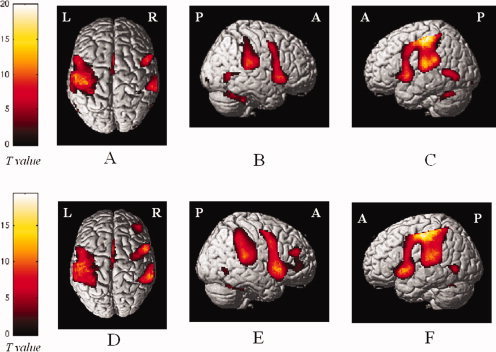
Cortical activations on a rendered brain from healthy controls (A–C) and patients with multiple sclerosis (D–F), during the performance of a simple motor task with the right hand (within‐group analysis; one‐sample t‐test). Activated foci are shown with a significance threshold set at P < 0.05, corrected for multiple comparisons (color‐coded t values). Images are in neurological convention. L, left; R, right. See text for further details.