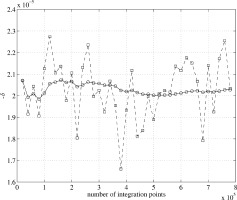
Figure 4.

Convergence of the Monte Carlo integration for −δ, the fractional reduction in the magnitude of the MRI signal, for the case that the MRI voxel is coincident with the neuronal activity. Each square is obtained by averaging
 over 20,000 randomly chosen positions as an approximation to Z in Eq. (7), and then evaluating
  . This process is repeated 39 times, and the circles represent the cumulative average of −δ.
