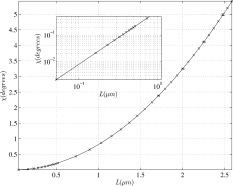
Figure 6.

The overall phase shift χ as a function of L when the activity is displaced 2/3 the length of the MRI voxel. The solid curve with very small error bars is the result of the simulation with all dendrites active, and the (x) symbols represent the approximation given in Eq. (10). The inset shows that
 for small L.
