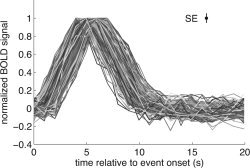
Figure 3.

Inspection of HDR estimates across voxels and event types. Using the POLY model (FIR model combined with polynomials), we obtained for each voxel an estimate of the HDR to each of the 12 event types. The figure depicts positive HDR estimates with a SNR of at least 30 (n = 216 from 212 unique voxels). The x‐axis indicates time relative to event onset; the y‐axis indicates the BOLD signal. For display purposes, each HDR estimate is normalized by dividing by its maximum value. The inset indicates the median standard error for the depicted data points. The robustness of the shapes of the timecourses indicates the high SNR in the data, despite the small voxel size (2 mm) and the moderate amount of data (17 min).
