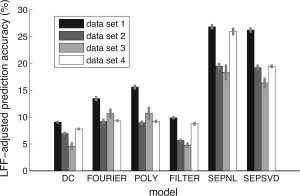
Figure 9.

Summary of data model performance. This graph summarizes results from four data sets involving different subjects, imaging parameters, and stimulus designs: the primary data set (illustrated in Figs. 1, 2, 3, 4, 5, 6, 7, 8) and three additional data sets. For each data set, we selected voxels (n = 2,223, 699, 236, 825, respectively) passing a minimum SNR threshold (= 10, 10, 7, 10, respectively) under any of the models that do not involve iterative fitting (this excludes the SEPNL model). (The SNR threshold is lowered for data set 3 due to low signal in that data set.) The x‐axis indicates the data models we evaluated; and the y‐axis indicates the LFF‐adjusted prediction accuracy. The height of each bar indicates the median across voxels, and the bar shading indicates the data set. Error bars indicate ±1 SE (bootstrap procedure). The same basic trend in performance was observed across the four data sets: the SEPNL and SEPSVD models were the most accurate, the FOURIER and POLY models were moderately accurate, and the DC and FILTER models were the least accurate.
