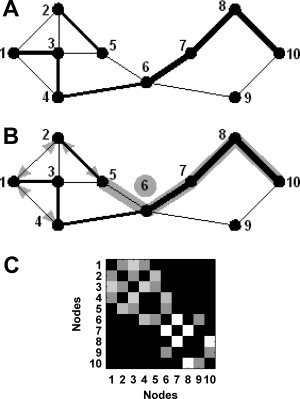
Figure 1.

(A) A graph is a basic representation of a network: as a minimum it comprises a collection of nodes (numbered), connected to each other by edges (lines). In weighted graphs, each edge is assigned a value reflecting the strength of the connection (line widths). (B) An illustration of network metrics used in this article. The shortest path between Nodes 5 and 10 is shaded (note that stronger weights correspond to shorter path lengths). Node 6 (circled) is a “hub”—a central node that is traversed by ∼50% of shortest paths in the network. The binary clustering coefficient for Node 3 equates to the number of edges connecting neighbors of 3, as a proportion of the total possible number of such edges. There are three present “neighbor–neighbor” edges (arrowheads) out of a possible six—yielding a binary clustering coefficient of 0.5. A calculation of weighted clustering coefficient will, in addition, incorporate weights of edges that connect Node 3 to its neighbors (for example: given that edges 3↔1 and 3↔4 have greater weights than 3↔2 and 3↔5, this will mean that the presence of edge 1↔4 will increase the weighted clustering coefficient to a greater extent than the presence of edge 2↔5). (C) A weights matrix representation of the graph in 1A. Squares represent connections between nodes (edges); brightness of squares corresponds to edge weights.
