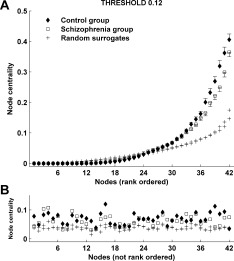
Figure 5.

(A) Mean rank‐ordered centrality indices of individual nodes in both groups at threshold 12%. Centrality was obtained from connected sparse graphs using a bridge‐preservation thresholding algorithm, as described in the Methods. Simple thresholding leads to disconnected graphs, significantly reducing the number of paths, thus obscuring individual node centralities (not shown). (B) Mean centrality indices in 5A, plotted without rank‐ordering by node.
