
Figure 6.
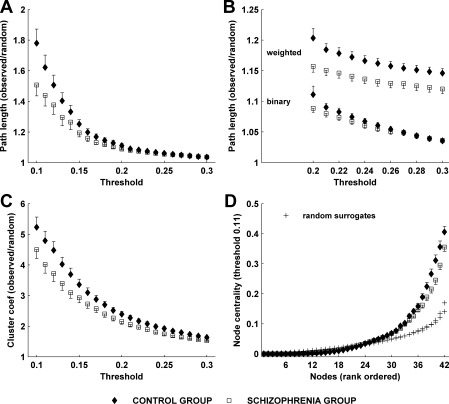
(A) Mean normalized path length for binary graphs of both subject groups. (B) A comparison of binary and weighted path lengths at thresholds 20–30%. (C) Mean normalized clustering coefficients for binary graphs of both subject groups. (D) Mean rank‐ordered centrality indices for binary graphs of both subject groups at threshold 12%.