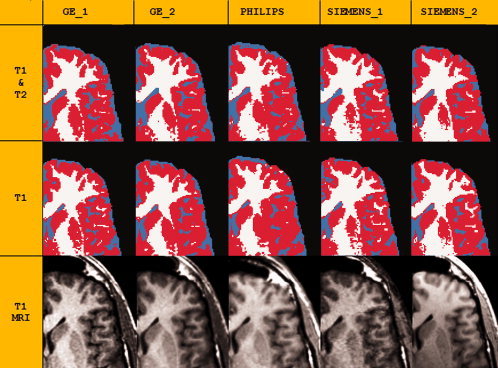
Figure 1.

Zoomed section of an axial view of the same subject scanned at five different centers, to illustrate qualitative differences of MRI and of tissue segmentation. Top: Results of tissue segmentation, using T1‐only or T1 and T2 data; tissue types are color coded: GM = red; WM = white; CSF = cyan. Bottom: MR scans. Scans were all registered to the image obtained with the Philips scanner. Note that the segmentation of WM and GM tissue seems more accurate in multimodal segmentation because the cortex distribution along the sulci and gyri looks more realistic, whereas the higher volumes of CSF obtained using T1 and T2 segmentation seem to arise from an exaggeration of sulcal spaces.
