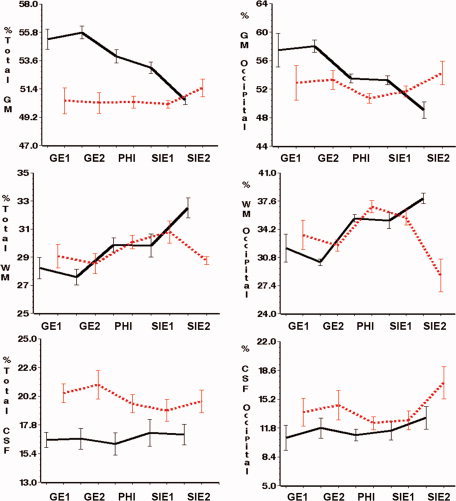
Figure 2.

Plots showing the volumetric measurements obtained at each site using T1 and T2 (light, dashed line) and T1‐only (black, solid line) tissue segmentation (see Methods for details). Bars represent 1 SD around the mean. Lines join within site mean values. Left column: Whole‐brain volumes (data expressed as a percentage of intracranial volume). Right column: Tissue volumes of the occipital lobe (data expressed as a percentage of the total volume for the occipital lobe). [Color figure can be viewed in the online issue, which is available at www.interscience.wiley.com.]
