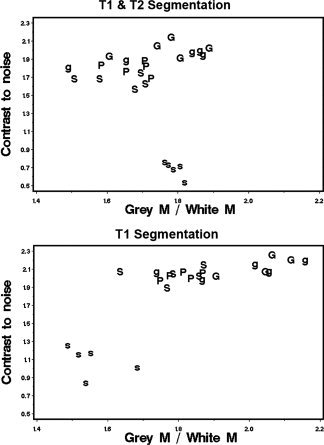
Figure 3.

Scatter plots showing the relationship between contrast‐to‐noise ratio and GM/WM ratio for each subject scanned. Top data obtained using T1 and T2 segmentation. Bottom: Data obtained using T1 scans only. Data points are labeled with the scanner used. G: GE_1; g: GE_2; P: Philips; S: SIEMENS_1; s: SIEMENS_2. To facilitate the comparison between the two segmentation methods, the same scale was used in both plots.
