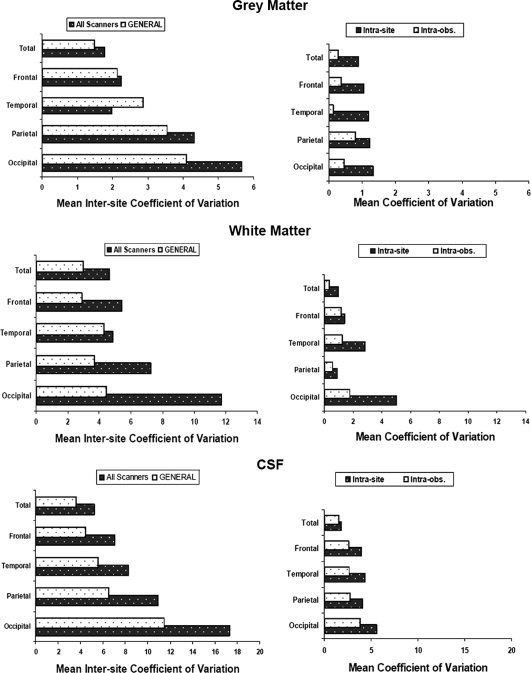
Figure 4.

Estimation of the error in our volume measurements in whole‐brain and lobar data of GM, WM, and CSF due to different sources: intersite, intrascanner, and intrarater (see Methods for details). Left column: All scanners; bars show average of within subject coefficients of variation between scanners in the five sites. GENERAL; bars show the mean coefficient of variation of the five subjects in the GE‐1 and GE‐2 sites only. Right column: Intrasite; variability due to MRI acquisition (subject positioning in the scanner). Intraobs; variability due to manual intervention in the ROI segmentation method (see Methods). To facilitate comparisons, notice that for each tissue type, the range of values in the horizontal axis is the same for left and right columns.
