
Figure 8.
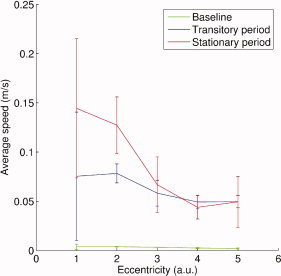
Variation of average flow velocity of cortical currents in the most posterior part of the calcarine fissure in the left hemisphere with stimulus eccentricity. The three curves correspond to baseline (in green), 0–400‐ms transition period (in blue), and up to 1,500 ms after the steady‐state response is established (in red).